| For: July 17, 2012 | |||||
| SYMBOL | OPEN RATE | HIGH RATE | LOW RATE | CLOSING RATE | TURNOVER |
| AABS | 85 | 85 | 84.99 | 85 | 800 |
| AACIL | 4.5 | 4.72 | 4.45 | 4.51 | 61,502 |
| ABL | 65.93 | 67.5 | 66.1 | 67.02 | 464,857 |
| ABOT | 133.04 | 135.99 | 132 | 133.41 | 188,105 |
| ACPL | 89.37 | 92 | 89.49 | 91.03 | 53,490 |
| ADAMS | 20.2 | 20.1 | 20.1 | 20.1 | 998 |
| ADMM | 25.03 | 26.28 | 25.4 | 25.74 | 2,003 |
| ADOS | 21.18 | 22.23 | 22.23 | 22.23 | 3,101 |
| AGIC | 9.13 | 9.4 | 9.14 | 9.3 | 679 |
| AGIL | 86.5 | 89.85 | 85.21 | 85.22 | 2,702 |
| AGL | 13.95 | 13.85 | 13 | 13.5 | 549 |
| AGTL | 207.98 | 208 | 207 | 208 | 2,153 |
| AHCL | 32.89 | 33.4 | 32.86 | 33.03 | 914,282 |
| AHCL-CAUG | 33.57 | 0 | 0 | 33.7 | 0 |
| AHCL-CJUL | 33.06 | 0 | 0 | 33.19 | 0 |
| AHCL-CSEP | 33.98 | 0 | 0 | 34.11 | 0 |
| AHCL-JUL | 33.06 | 33.5 | 33.05 | 33.13 | 297,500 |
| AHI | 15.35 | 16.13 | 15.76 | 16.02 | 21,028 |
| AHL | 38.96 | 40.9 | 39.05 | 40.9 | 518,818 |
| AICL | 63.77 | 66.59 | 63.5 | 66.39 | 1,681,237 |
| AKBL | 14.34 | 15.2 | 14.3 | 15 | 3,609,206 |
| AKDCL | 31.52 | 33.09 | 31.2 | 32.99 | 1,515 |
| AKGL | 8.5 | 9.2 | 9.2 | 8.5 | 200 |
| AKZO | 118.3 | 112.39 | 112.39 | 112.39 | 1,375 |
| ALNRS | 50.66 | 50.25 | 48.75 | 50.66 | 140 |
| AMBL | 11.45 | 12.35 | 11.25 | 11.94 | 136,742 |
| AMTEX | 2.02 | 2.11 | 1.96 | 1.99 | 225,938 |
| ANL | 6.53 | 6.75 | 6.52 | 6.69 | 1,609,377 |
| APL | 480.05 | 481.89 | 479 | 480.26 | 6,295 |
| ARM | 39.99 | 41.9 | 41 | 39.99 | 252 |
| ASHT | 10.25 | 10.25 | 10.25 | 10.25 | 1,000 |
| ATBA | 226.3 | 226.99 | 220 | 224.01 | 13,015 |
| ATFF | 8.86 | 9 | 8.89 | 9 | 2,896 |
| ATIL | 31.87 | 32.3 | 31.55 | 32.25 | 10,131 |
| ATLH | 122 | 122.9 | 121.5 | 122.85 | 1,087 |
| ATRL | 125.6 | 126.4 | 125.65 | 125.84 | 122,223 |
| ATRL-CAUG | 128.21 | 0 | 0 | 128.39 | 0 |
| ATRL-CJUL | 126.27 | 0 | 0 | 126.45 | 0 |
| ATRL-CSEP | 129.76 | 0 | 0 | 129.95 | 0 |
| ATRL-JUL | 126.14 | 126.89 | 126.25 | 126.4 | 38,000 |
| BAFL | 17.45 | 17.85 | 17.47 | 17.71 | 1,558,593 |
| BAFL-CAUG | 17.81 | 0 | 0 | 18.07 | 0 |
| BAFL-CJUL | 17.54 | 0 | 0 | 17.8 | 0 |
| BAFL-CSEP | 18.03 | 0 | 0 | 18.29 | 0 |
| BAFL-JUL | 17.54 | 17.9 | 17.78 | 17.89 | 75,500 |
| BAFS | 37.05 | 37 | 37 | 37 | 0 |
| BAHL | 28.73 | 28.99 | 28.6 | 28.76 | 124,897 |
| BAHL-CAUG | 29.33 | 0 | 0 | 29.34 | 0 |
| BAHL-CJUL | 28.88 | 0 | 0 | 28.9 | 0 |
| BAHL-CSEP | 29.68 | 0 | 0 | 29.7 | 0 |
| BAPL | 7.92 | 8.15 | 8 | 8 | 4,002 |
| BATA | 650.12 | 680 | 620.1 | 674.39 | 1,029 |
| BCL | 37.89 | 39.78 | 37.95 | 37.89 | 221 |
| BCML | 15.78 | 16 | 15 | 15 | 5,500 |
| BELA | 1.3429 | 1.5 | 1.25 | 1.3 | 10,000 |
| BERG | 13 | 14 | 13 | 14 | 51,919 |
| BFMOD | 4.5 | 4.25 | 3.8 | 4.12 | 1,460 |
| BGL | 3.18 | 3.25 | 3.2 | 3.25 | 17,335 |
| BIFO | 56 | 55.86 | 55.86 | 56 | 10 |
| BIPL | 9.7 | 10.2 | 9.61 | 9.8 | 215,740 |
| BNWM | 22.5 | 23 | 22.76 | 23 | 1,149 |
| BOK | 8.5 | 8.64 | 8.41 | 8.5 | 19,069 |
| BOP | 8.06 | 8.43 | 8.07 | 8.3 | 1,463,748 |
| BPBL | 6.65 | 6.85 | 6.85 | 6.65 | 1 |
| BPL | 49.56 | 50.18 | 49.01 | 49.13 | 38,037 |
| BROT | 1.26 | 1.33 | 1.25 | 1.26 | 8,000 |
| BRR | 2.6 | 2.6 | 2.3 | 2.49 | 2,142 |
| BUXL | 8.14 | 8.99 | 8.99 | 8.14 | 1 |
| BWHL | 30.43 | 31 | 30.5 | 30.43 | 109 |
| BYCO | 8.57 | 8.84 | 8.52 | 8.6 | 968,690 |
| CCM | 24.04 | 24 | 23 | 24.04 | 100 |
| CECL | 12.78 | 13.78 | 13.78 | 13.78 | 1,000 |
| CENI | 10.99 | 10.98 | 10.7 | 10.79 | 16,700 |
| CEPB | 20.14 | 21.1 | 20.01 | 20.2 | 331,041 |
| CHAS | 7.9 | 8.1 | 7.51 | 7.92 | 2,101 |
| CHBL | 1.6 | 1.9 | 1.6 | 1.85 | 684 |
| CHCC | 33.09 | 34.4 | 33 | 34.31 | 1,688,653 |
| CJPL | 0.87 | 0.88 | 0.8 | 0.87 | 1,445 |
| CLCPS | 0.32 | 0.53 | 0.53 | 0.32 | 5 |
| CLOV | 83.32 | 84.45 | 82 | 83.32 | 286 |
| CML | 1.56 | 1.68 | 1.56 | 1.56 | 4,106 |
| COLG | 1195 | 1135.3 | 1135.26 | 1135.3 | 120 |
| COTT | 2.1 | 2.1 | 1.9 | 1.9 | 501 |
| CPL | 191.57 | 201.14 | 192.5 | 201.14 | 36,217 |
| CPPL | 31.17 | 32.72 | 32.4 | 32.72 | 25,356 |
| CRTM | 9.51 | 9.88 | 9.76 | 9.88 | 1,450 |
| CSAP | 22.5 | 22.85 | 22.3 | 22.67 | 1,251 |
| CSM | 0.88 | 1.05 | 0.86 | 0.94 | 53,978 |
| CSUML | 3.01 | 3.43 | 3 | 3 | 20,510 |
| CWSM | 2.4 | 2.8 | 2.31 | 2.8 | 50,002 |
| CYAN | 68 | 69.7 | 68 | 68 | 359 |
| DADX | 47 | 46.65 | 46 | 47 | 415 |
| DATM | 0.63 | 0.65 | 0.64 | 0.63 | 2 |
| DAWH | 31.25 | 31.8 | 31.06 | 31.16 | 186,486 |
| DAWH-CJUL | 31.42 | 0 | 0 | 31.31 | 0 |
| DBCI | 2.11 | 2.3 | 2.02 | 2.18 | 150,466 |
| DCH | 2.34 | 2.39 | 2.25 | 2.26 | 109,002 |
| DCL | 3.95 | 4.07 | 3.95 | 4 | 386,552 |
| DCM | 1.45 | 1.5 | 1.5 | 1.45 | 54 |
| DEL | 1.81 | 1.93 | 1.79 | 1.82 | 2,070 |
| DFML | 2.32 | 2.33 | 2.25 | 2.26 | 17,181 |
| DFSM | 2.8 | 2.3 | 1.8 | 2.13 | 2,097 |
| DGKC | 44.64 | 45.34 | 44.76 | 44.92 | 12,813,009 |
| DGKC-CAUG | 45.57 | 0 | 0 | 45.83 | 0 |
| DGKC-CJUL | 44.88 | 0 | 0 | 45.14 | 0 |
| DGKC-CSEP | 46.12 | 0 | 0 | 46.39 | 0 |
| DGKC-JUL | 44.9 | 45.45 | 44.91 | 45.06 | 7,290,000 |
| DINT | 16 | 16.93 | 16.93 | 16.93 | 500 |
| DKTM | 2 | 1.61 | 1 | 1.61 | 1,502 |
| DLL | 62 | 64.22 | 62 | 62.05 | 13,208 |
| DMTM | 7.6 | 7.79 | 7.1 | 7.6 | 152 |
| DNCC | 2.5 | 2.54 | 2.41 | 2.54 | 829 |
| DOL | 4.06 | 4.16 | 3.94 | 4.1 | 56,981 |
| DSFL | 1.7 | 1.78 | 1.68 | 1.71 | 117,889 |
| DSIL | 1.47 | 1.58 | 1.45 | 1.56 | 10,132 |
| DSL | 2.45 | 2.6 | 2.45 | 2.45 | 62,645 |
| DSML | 5.15 | 6.15 | 5.75 | 5.75 | 1,001 |
| DWAE | 2.5 | 2.68 | 2.41 | 2.5 | 18,497 |
| DWSM | 2.64 | 3 | 2.54 | 2.98 | 5,903 |
| DYNO | 20.5 | 21.52 | 20.55 | 21.52 | 25,893 |
| ECOP | 5.81 | 6.12 | 5 | 5.55 | 4,404 |
| EFOODS | 69.82 | 72 | 66.51 | 67.66 | 8,036,113 |
| EFUG | 71.49 | 72.5 | 71 | 72.03 | 3,301 |
| EFUL | 72.68 | 74 | 72.06 | 73.09 | 2,100 |
| EMCO | 2.85 | 2.96 | 2.75 | 2.75 | 1,002 |
| ENGRO | 102.65 | 103.5 | 101.6 | 101.95 | 1,162,632 |
| ENGRO-CAUG | 104.78 | 0 | 0 | 104.02 | 0 |
| ENGRO-CJUL | 103.19 | 0 | 0 | 102.44 | 0 |
| ENGRO-CSEP | 106.05 | 0 | 0 | 105.28 | 0 |
| ENGRO-JUL | 103.13 | 103.7 | 102 | 102.31 | 465,500 |
| ENGROTFC | 99.1835 | 0 | 0 | 99.1835 | 0 |
| ENGROTFC2 | 100 | 0 | 0 | 100 | 0 |
| EPCL | 9.97 | 10.08 | 9.81 | 9.88 | 587,180 |
| ESBL | 1.95 | 1.85 | 1.71 | 1.71 | 11,734 |
| EXIDE | 168.9 | 173 | 171 | 171 | 1,531 |
| FABL | 10.9 | 11.05 | 10.75 | 10.91 | 93,004 |
| FABLTFC | 101.25 | 0 | 0 | 101.25 | 0 |
| FANM | 4.92 | 4.99 | 4.35 | 4.37 | 5,425 |
| FATIMA | 24.95 | 25.24 | 24.85 | 24.9 | 1,510,676 |
| FCCL | 5.85 | 5.93 | 5.79 | 5.85 | 1,528,524 |
| FCIBL | 2.81 | 3.5 | 3 | 3 | 12,008 |
| FCSC | 2.8 | 2.88 | 2.75 | 2.8 | 14,712 |
| FDIBL | 1.35 | 1.5 | 1.41 | 1.35 | 2,451 |
| FDMF | 4.12 | 4.1 | 4.07 | 4.07 | 25,600 |
| FECM | 3.42 | 3.42 | 3.21 | 3.25 | 3,401 |
| FECTC | 17.29 | 18.29 | 17.02 | 18.29 | 575,293 |
| FEM | 1.3 | 1.5 | 1.3 | 1.5 | 16,686 |
| FEROZ | 85.41 | 85 | 84 | 84 | 1,772 |
| FFBL | 38.69 | 39 | 38.5 | 38.73 | 1,580,762 |
| FFBL-CAUG | 39.49 | 0 | 0 | 39.52 | 0 |
| FFBL-CJUL | 38.9 | 0 | 0 | 38.92 | 0 |
| FFBL-CSEP | 39.97 | 0 | 0 | 39.99 | 0 |
| FFBL-JUL | 38.95 | 39.15 | 38.7 | 38.94 | 210,500 |
| FFC | 116.72 | 117.59 | 116.81 | 117 | 1,430,740 |
| FFC-CAUG | 119.14 | 0 | 0 | 119.37 | 0 |
| FFC-CJUL | 117.34 | 0 | 0 | 117.57 | 0 |
| FFC-CSEP | 120.59 | 0 | 0 | 120.82 | 0 |
| FFC-JUL | 117.31 | 117.9 | 117.11 | 117.38 | 216,000 |
| FFLM | 2.8 | 2.6 | 2.6 | 2.8 | 20 |
| FHAM | 8.35 | 8.05 | 8.05 | 8.05 | 2,500 |
| FHBM | 9.6 | 9.4 | 9.4 | 9.4 | 6,946 |
| FIBLM | 1.4 | 0.72 | 0.72 | 0.72 | 1,473 |
| FIMM | 52.61 | 55 | 55 | 52.61 | 100 |
| FLYNG | 2.83 | 3.06 | 2.81 | 2.98 | 393,279 |
| FML | 37.15 | 36.15 | 36.15 | 36.15 | 0 |
| FNBM | 5.01 | 5.3 | 5.06 | 5.06 | 12,900 |
| FNEL | 5.9 | 5.85 | 5.25 | 5.9 | 7 |
| FPJM | 1.48 | 1.1 | 1.1 | 1.1 | 504 |
| FPRM | 13.9 | 13 | 13 | 13.9 | 333 |
| FRCL | 3.85 | 4.13 | 4.13 | 3.85 | 5,182 |
| FRSM | 22 | 21.8 | 21.8 | 22 | 553 |
| FTSM | 0.89 | 0.81 | 0.81 | 0.89 | 1 |
| FUDLM | 7.7 | 7.7 | 7.5 | 7.6 | 28,000 |
| FZCM | 90.01 | 87.01 | 87.01 | 90.01 | 10 |
| GADT | 66.08 | 66.25 | 66.25 | 66.08 | 94 |
| GAIL | 2.52 | 2.8 | 2.35 | 2.37 | 1,052 |
| GAMON | 2.59 | 2.24 | 2.01 | 2.11 | 4,700 |
| GASF | 5.49 | 5.59 | 5.4 | 5.55 | 31,554 |
| GATM | 21 | 21.97 | 21.5 | 21.97 | 505 |
| GENP | 1.01 | 1.04 | 1 | 1 | 7,702 |
| GGL | 10.5 | 11.08 | 10.25 | 10.81 | 125,417 |
| GHGL | 51.8 | 52.5 | 50.95 | 50.99 | 14,285 |
| GHNI | 9.42 | 9.57 | 8.45 | 8.54 | 81,552 |
| GHNL | 5.73 | 5.79 | 5 | 5.08 | 143,469 |
| GLAXO | 72.71 | 73.9 | 71 | 71.42 | 337,053 |
| GRAYS | 26.17 | 26.05 | 26 | 26.17 | 462 |
| GSPM | 5.26 | 5.4 | 5 | 5.4 | 10,484 |
| GTYR | 22.75 | 23 | 22.6 | 22.76 | 12,956 |
| GVGL | 25.75 | 24.5 | 24.5 | 24.5 | 100 |
| HABSM | 23.38 | 23.4 | 23.15 | 23.15 | 17,164 |
| HADC | 1.94 | 2.22 | 1.51 | 2 | 14,982 |
| HAJT | 0.9 | 1.18 | 1.18 | 0.9 | 1 |
| HAL | 22.52 | 22.49 | 22.26 | 22.28 | 1,817 |
| HBL | 113.72 | 116 | 113.5 | 114.98 | 172,571 |
| HCAR | 16.19 | 16.24 | 15.19 | 15.24 | 1,022,213 |
| HICL | 11.32 | 11.48 | 11.36 | 11.48 | 4,510 |
| HINO | 82.82 | 86.96 | 82.6 | 83.4 | 17,945 |
| HINOON | 38.4 | 38.5 | 36.78 | 38.23 | 996 |
| HIRAT | 10.7 | 10.46 | 9.9 | 9.99 | 43,819 |
| HMB | 18 | 18.21 | 17.8 | 18.2 | 12,759 |
| HSPI | 22.35 | 22.85 | 22 | 22.51 | 3,012 |
| HUBC | 43.41 | 43.84 | 43.26 | 43.63 | 1,326,674 |
| HUBC-CAUG | 44.31 | 0 | 0 | 44.52 | 0 |
| HUBC-CJUL | 43.64 | 0 | 0 | 43.84 | 0 |
| HUBC-CSEP | 44.85 | 0 | 0 | 45.05 | 0 |
| HUBC-JUL | 43.66 | 44.43 | 43.8 | 44 | 3,000 |
| HUMNL | 21.01 | 21.85 | 21.75 | 21.01 | 25 |
| HUSS | 16.84 | 16.84 | 16.84 | 16.84 | 120 |
| IBFL | 49.14 | 51.5 | 49.2 | 49.14 | 894 |
| IBLHL | 23.38 | 24.24 | 22.61 | 23.84 | 7,813 |
| ICCT | 1.9 | 1.72 | 1.65 | 1.71 | 552 |
| ICI | 144.5 | 151.5 | 144 | 148.78 | 144,249 |
| ICIBL | 0.75 | 0.8 | 0.72 | 0.75 | 43,876 |
| ICL | 22.23 | 23.34 | 23.19 | 22.23 | 50 |
| IDRT | 6.8 | 7.5 | 7.5 | 6.8 | 15 |
| IDYM | 403.27 | 400 | 400 | 403.27 | 1 |
| IFSL | 16.75 | 16.8 | 16.7 | 16.7 | 1,600 |
| IGIBL | 2.18 | 2.44 | 2.18 | 2.2 | 117,149 |
| IGIIL | 63 | 64 | 63.5 | 63.89 | 11,010 |
| ILTM | 216.01 | 215 | 206 | 214.13 | 121 |
| INDU | 266.52 | 268.15 | 266.1 | 268.01 | 1,100 |
| INIL | 28.5 | 29 | 28.5 | 28.5 | 10,998 |
| ISIL | 104.37 | 101.1 | 100 | 101.1 | 505 |
| ISL | 12.36 | 12.5 | 12.45 | 12.48 | 10,500 |
| JATM | 2.53 | 2.54 | 2.5 | 2.53 | 11 |
| JDMT | 19.61 | 20.6 | 20.59 | 20.59 | 700 |
| JGICL | 54.33 | 55.3 | 55 | 54.33 | 186 |
| JLICL | 72.5 | 73.95 | 73.95 | 72.5 | 400 |
| JOPP | 9.4 | 10.29 | 10.29 | 9.4 | 1 |
| JPGL | 1.7 | 1.8 | 1.67 | 1.69 | 210,344 |
| JSBL | 5.17 | 5.35 | 5.16 | 5.28 | 524,790 |
| JSCL | 14.03 | 14.77 | 14.16 | 14.66 | 13,496,114 |
| JSGCL | 29.35 | 30.5 | 29.35 | 30.41 | 11,465 |
| JSGF | 8.34 | 8.25 | 8.1 | 8.22 | 21,167 |
| JSIL | 8.15 | 8.49 | 8.19 | 8.41 | 1,563,626 |
| JSVFL | 8.15 | 8.1 | 7.9 | 8.01 | 25,163 |
| KAPCO | 44.57 | 44.97 | 44.5 | 44.89 | 23,942 |
| KAPCO-CAUG | 45.5 | 0 | 0 | 45.8 | 0 |
| KAPCO-CJUL | 44.81 | 0 | 0 | 45.11 | 0 |
| KASBB | 2.24 | 2.27 | 2.18 | 2.21 | 28,465 |
| KASBSL | 4.1 | 4.7 | 4.01 | 4.07 | 59,624 |
| KESC | 3.7 | 3.8 | 3.7 | 3.74 | 219,462 |
| KHTC | 50 | 52.5 | 52.5 | 50 | 21 |
| KML | 2.9 | 2.9 | 2.9 | 2.9 | 10,999 |
| KOHC | 48.57 | 50.99 | 48.5 | 50.91 | 809,676 |
| KOHE | 22.04 | 21.1 | 21.1 | 21.1 | 500 |
| KOHS | 3.55 | 3.9 | 3.75 | 3.9 | 1,556 |
| KOHTM | 6 | 6.3 | 6.1 | 6.17 | 15,000 |
| KOIL | 1.19 | 1.14 | 1.07 | 1.08 | 15,403 |
| KOSM | 1.67 | 1.95 | 1.94 | 1.95 | 1,000 |
| KSBP | 60.04 | 63.04 | 59.1 | 62.64 | 6,474 |
| KSTM | 1.15 | 1.1 | 1.1 | 1.15 | 40 |
| KTML | 4.3 | 4.8 | 4.3 | 4.64 | 62,605 |
| LIBM | 62.57 | 61.7 | 59.56 | 61.7 | 428 |
| LINDE | 130.08 | 130 | 128 | 128.02 | 1,709 |
| LOTPTA | 7.17 | 7.74 | 7.16 | 7.56 | 8,726,338 |
| LOTPTA-JUL | 7.2 | 7.77 | 7.2 | 7.56 | 490,500 |
| LPCL | 4.61 | 4.73 | 4.62 | 4.67 | 1,806,966 |
| LPGL | 13 | 13.99 | 12.51 | 13.97 | 508 |
| LUCK | 126.63 | 128.75 | 126.81 | 128.34 | 4,071,192 |
| LUCK-CAUG | 129.26 | 0 | 0 | 130.94 | 0 |
| LUCK-CJUL | 127.3 | 0 | 0 | 128.96 | 0 |
| LUCK-CSEP | 130.82 | 0 | 0 | 132.53 | 0 |
| LUCK-JUL | 127 | 128.98 | 127.2 | 128.63 | 853,000 |
| MACFL | 20 | 20.68 | 19.36 | 19.82 | 49,187 |
| MARI | 96.72 | 97 | 95.26 | 95.52 | 33,728 |
| MBF | 11.01 | 11.16 | 11 | 11.03 | 84,631 |
| MCB | 179.08 | 183.75 | 178.5 | 183.03 | 620,479 |
| MCB-CAUG | 182.8 | 0 | 0 | 186.74 | 0 |
| MCB-CJUL | 180.03 | 0 | 0 | 183.92 | 0 |
| MCB-CSEP | 185.01 | 0 | 0 | 189 | 0 |
| MCB-JUL | 179.52 | 183.5 | 179.22 | 183.22 | 86,500 |
| MDTL | 4.21 | 4.69 | 4 | 4.32 | 5,700 |
| MEBL | 28.35 | 28.55 | 28.36 | 28.37 | 29,997 |
| MERIT | 22.49 | 23.39 | 21.4 | 22.49 | 1,215 |
| MFFL | 302.76 | 301 | 291 | 302.76 | 365 |
| MLCF | 5.1 | 5.3 | 5.08 | 5.26 | 810,323 |
| MODAM | 1.01 | 1.03 | 0.63 | 1 | 14,902 |
| MOON | 6.9 | 6 | 6 | 6.9 | 1 |
| MQTM | 13.25 | 12.75 | 12.75 | 12.75 | 2,648 |
| MRNS | 41.8 | 42.49 | 42 | 42 | 1,069 |
| MTIL | 1.04 | 1.38 | 0.17 | 0.91 | 141,003 |
| MTL | 490.54 | 493 | 491 | 491.1 | 3,166 |
| MUKT | 0.81 | 0.8 | 0.8 | 0.81 | 1 |
| MUREB | 105 | 110.25 | 103.1 | 110.24 | 25,984 |
| MWMP | 2.94 | 3.75 | 3 | 3.43 | 97,783 |
| MZSM | 2.46 | 2.45 | 2.26 | 2.26 | 2,210 |
| NAGC | 23.5 | 23.8 | 23 | 23.5 | 2 |
| NATF | 203.8 | 209 | 200 | 207.59 | 12,525 |
| NBF | 4.4 | 3.78 | 3.78 | 4.4 | 100 |
| NBP | 44.98 | 45.82 | 44.93 | 45.42 | 3,132,155 |
| NBP-CAUG | 45.91 | 0 | 0 | 46.34 | 0 |
| NBP-CJUL | 45.22 | 0 | 0 | 45.64 | 0 |
| NBP-CSEP | 46.47 | 0 | 0 | 46.9 | 0 |
| NBP-JUL | 45.19 | 46 | 45.2 | 45.63 | 342,000 |
| NCL | 17.4 | 17.65 | 17.41 | 17.54 | 64,740 |
| NCPL | 15.25 | 15.46 | 15.28 | 15.33 | 1,013,942 |
| NESTLE | 4117 | 4133 | 3915.02 | 4090.34 | 29 |
| NETSOL | 14.59 | 15.59 | 14.7 | 15.19 | 1,240,062 |
| NEXT | 8.99 | 8.1 | 8.1 | 8.99 | 16 |
| NIB | 2.38 | 2.49 | 2.39 | 2.4 | 2,798,044 |
| NIBTFC | 99.55 | 0 | 0 | 99.55 | 0 |
| NICL | 3.41 | 3.7 | 3.3 | 3.4 | 140,792 |
| NML | 51.14 | 51.99 | 51.2 | 51.52 | 1,097,528 |
| NML-CAUG | 52.2 | 0 | 0 | 52.57 | 0 |
| NML-CJUL | 51.41 | 0 | 0 | 51.77 | 0 |
| NML-CSEP | 52.83 | 0 | 0 | 53.2 | 0 |
| NML-JUL | 51.4 | 52.19 | 51.5 | 51.75 | 193,000 |
| NONS | 18.6 | 19 | 19 | 18.6 | 20 |
| NOPK | 44.85 | 45 | 42.8 | 45 | 25,312 |
| NOPKNV | 17.5 | 17.5 | 17.3 | 17.5 | 24,300 |
| NPL | 14.95 | 15.1 | 14.92 | 15 | 21,837 |
| NRL | 238.1 | 240 | 238.52 | 239.98 | 24,304 |
| OGDC | 168.12 | 169.89 | 167.1 | 167.8 | 386,820 |
| OGDC-CAUG | 171.61 | 0 | 0 | 171.2 | 0 |
| OGDC-CJUL | 169.01 | 0 | 0 | 168.61 | 0 |
| OGDC-CSEP | 173.69 | 0 | 0 | 173.28 | 0 |
| OGDC-JUL | 168.53 | 169 | 168 | 168.31 | 9,000 |
| OLPL | 11 | 11.2 | 10.8 | 10.8 | 41,702 |
| OLTM | 5.95 | 5.99 | 5.45 | 5.68 | 8,761 |
| PACE | 2 | 2.08 | 1.98 | 2.04 | 233,697 |
| PAEL | 5.79 | 5.9 | 5.67 | 5.8 | 273,368 |
| PAKD | 62 | 62 | 61.75 | 62 | 5,251 |
| PAKMI | 1.68 | 1.66 | 1.61 | 1.68 | 328 |
| PAKRI | 17.14 | 17.8 | 17.15 | 17.65 | 576,124 |
| PAKT | 50.71 | 51.49 | 49 | 51.11 | 6,768 |
| PASL | 1.85 | 1.98 | 1.85 | 1.88 | 212,091 |
| PASM | 6.79 | 6.88 | 6.51 | 6.79 | 51 |
| PCAL | 41.36 | 41.7 | 41.5417 | 41.5417 | 365 |
| PECO | 40.01 | 41.99 | 39.85 | 40.29 | 64,830 |
| PEF | 8.7 | 8.75 | 7.81 | 8.73 | 39,056 |
| PFLTFC2 | 100.1333 | 0 | 0 | 100.1333 | 0 |
| PGCL | 128.5 | 133 | 132 | 132 | 1,020 |
| PGF | 13.58 | 13.5 | 13.3 | 13.49 | 76,982 |
| PHDL | 30 | 31.5 | 28.51 | 30 | 93 |
| PIAA | 2.11 | 2.3 | 2.1 | 2.24 | 101,462 |
| PICT | 148.73 | 153.99 | 148 | 149.17 | 11,191 |
| PIF | 6.24 | 6.27 | 6.05 | 6.15 | 137,419 |
| PIL | 7.57 | 7.75 | 6.7 | 6.85 | 2,673 |
| PINL | 7.28 | 7.3 | 7.28 | 7.28 | 410 |
| PIOC | 11.28 | 11.99 | 11 | 11.8 | 404,518 |
| PKGI | 7 | 8 | 7 | 8 | 12,211 |
| PKGP | 14.23 | 14.47 | 14.2 | 14.23 | 52,808 |
| PKGS | 95.76 | 97.5 | 96 | 96 | 7,403 |
| PMI | 1.1 | 1.26 | 1.07 | 1.1 | 10,701 |
| PMPK | 149 | 152 | 147.25 | 148.01 | 267 |
| PMTFC6 | 98.75 | 0 | 0 | 98.75 | 0 |
| PNGRS | 2.3 | 2.3 | 2.27 | 2.3 | 253 |
| PNSC | 17.33 | 17.65 | 17.31 | 17.58 | 8,012 |
| POL | 383.68 | 390 | 384.7 | 389.14 | 287,682 |
| POL-CAUG | 391.64 | 0 | 0 | 397.04 | 0 |
| POL-CJUL | 385.71 | 0 | 0 | 391.03 | 0 |
| POL-CSEP | 396.39 | 0 | 0 | 401.84 | 0 |
| POL-JUL | 384.87 | 389.5 | 384.55 | 389.03 | 107,000 |
| POML | 53.01 | 50.41 | 50.41 | 53.01 | 4 |
| PPL | 194.65 | 197.45 | 194.65 | 196.07 | 677,555 |
| PPL-CAUG | 198.69 | 0 | 0 | 200.05 | 0 |
| PPL-CJUL | 195.68 | 0 | 0 | 197.02 | 0 |
| PPL-CSEP | 201.1 | 0 | 0 | 202.47 | 0 |
| PPL-JUL | 195.36 | 197.8 | 195.95 | 197 | 63,000 |
| PPP | 48.25 | 47.5 | 46.15 | 46.49 | 1,225 |
| PRET | 32 | 32 | 31.3 | 32 | 484 |
| PRL | 59.06 | 59.99 | 58.65 | 58.8 | 1,369 |
| PRWM | 9.6 | 9.6 | 9.36 | 9.6 | 139 |
| PSMC | 105.32 | 106.6 | 102.1 | 102.86 | 67,113 |
| PSO | 243.36 | 245.4 | 243.25 | 243.65 | 159,420 |
| PSO-CAUG | 248.41 | 0 | 0 | 248.59 | 0 |
| PSO-CJUL | 244.65 | 0 | 0 | 244.83 | 0 |
| PSO-CSEP | 251.42 | 0 | 0 | 251.6 | 0 |
| PSO-JUL | 244.67 | 246 | 244.51 | 244.9 | 12,000 |
| PSYL | 16.8 | 16.38 | 16.03 | 16.8 | 3 |
| PTC | 14.48 | 14.9 | 14.55 | 14.78 | 1,439,007 |
| PTC-CAUG | 14.78 | 0 | 0 | 15.08 | 0 |
| PTC-CJUL | 14.56 | 0 | 0 | 14.85 | 0 |
| PTC-CSEP | 14.96 | 0 | 0 | 15.26 | 0 |
| PTC-JUL | 14.58 | 14.95 | 14.57 | 14.86 | 32,500 |
| PTEC | 5 | 5 | 5 | 5 | 3 |
| QUICE | 10.06 | 10.29 | 9.92 | 9.95 | 88,864 |
| RAVT | 1.2 | 1.21 | 1.13 | 1.15 | 14,002 |
| RCML | 22.9 | 23.47 | 23.47 | 22.9 | 30 |
| REDT | 0.61 | 0.62 | 0.62 | 0.62 | 1,000 |
| RMPL | 3475 | 3599 | 3599 | 3475 | 1 |
| RUPL | 25.5 | 25.9 | 25.9 | 25.5 | 1 |
| SALT | 33.07 | 34.72 | 34.72 | 33.07 | 23 |
| SAPL | 193.22 | 197.99 | 190 | 193.22 | 5 |
| SAZEW | 30.85 | 32.39 | 30.3 | 31.07 | 5,085 |
| SBL | 2.3 | 2.47 | 2.23 | 2.25 | 19,820 |
| SCBPL | 11.5 | 11.99 | 11.8 | 11.92 | 16,017 |
| SCM | 11.89 | 11.75 | 11.5 | 11.75 | 3,678 |
| SEARL | 52.23 | 52.5 | 49.81 | 49.9 | 24,750 |
| SEPCO | 1.2 | 1.29 | 1.15 | 1.21 | 34,045 |
| SEPL | 46.35 | 47.24 | 46.28 | 46.38 | 756 |
| SFAT | 4.4 | 5.39 | 5.39 | 4.4 | 1 |
| SFWF | 8.5 | 8.81 | 8.81 | 8.5 | 292 |
| SGML | 13.04 | 13.24 | 12.65 | 12.8 | 38,837 |
| SGPL | 0.9 | 1.26 | 1.26 | 0.9 | 1 |
| SHCI | 1.51 | 1.59 | 1.45 | 1.59 | 8,544 |
| SHEL | 130 | 130.2 | 129 | 129.05 | 10,338 |
| SHEZ | 196.52 | 195.01 | 195.01 | 196.52 | 1 |
| SHFA | 31 | 31.97 | 31 | 31.85 | 910 |
| SHNI | 10.28 | 10.85 | 10.85 | 10.28 | 200 |
| SHSML | 9.66 | 10 | 9.65 | 10 | 19,815 |
| SIEM | 645 | 669.99 | 650 | 645 | 5 |
| SILK | 2.28 | 2.33 | 2.26 | 2.3 | 202,554 |
| SING | 21.3 | 20.34 | 20.34 | 21.3 | 10 |
| SITC | 109 | 114.45 | 109 | 113.04 | 36,795 |
| SJTM | 2.34 | 2.94 | 1.41 | 2.34 | 196 |
| SLYT | 6.2 | 6.5 | 5.5 | 5.89 | 3,723 |
| SMBL | 3.5 | 3.53 | 3.45 | 3.46 | 149,971 |
| SMBLTFC | 98.25 | 0 | 0 | 98.25 | 0 |
| SMCPL | 6.2 | 6.2 | 6.1 | 6.2 | 5,500 |
| SMTM | 4.14 | 4.24 | 3.76 | 4.14 | 2 |
| SNAI | 41.27 | 42 | 41.5 | 41.68 | 1,164 |
| SNBL | 8.09 | 8.29 | 8.05 | 8.07 | 191,414 |
| SNGP | 17.67 | 18.44 | 17.79 | 18.13 | 199,951 |
| SPL | 10.69 | 10.8 | 10.4 | 10.46 | 99,745 |
| SPLC | 0.81 | 0.88 | 0.62 | 0.62 | 3,077 |
| SRVI | 168.52 | 169.75 | 169.75 | 168.52 | 1 |
| SSGC | 20.3 | 20.5 | 20.2 | 20.34 | 18,341 |
| SSIC | 5.38 | 6.2 | 4.51 | 4.51 | 1,501 |
| STCL | 7.35 | 7.5 | 7.5 | 7.5 | 820 |
| STML | 13.3 | 12.3 | 12.3 | 13.3 | 5 |
| STPL | 7.56 | 7.9 | 7.44 | 7.5 | 91,632 |
| TATM | 20.22 | 21.19 | 21.19 | 20.22 | 105 |
| TDIL | 10.11 | 10.2 | 9.95 | 10.11 | 21,752 |
| TELE | 1.51 | 1.6 | 1.51 | 1.56 | 281,144 |
| TGL | 16.52 | 16.89 | 16.5 | 16.74 | 7,588 |
| THALL | 117.08 | 117 | 114.25 | 114.92 | 4,650 |
| TPL | 9.42 | 9.6 | 9.1 | 9.47 | 64,403 |
| TREET | 49.81 | 50 | 48.6 | 48.97 | 94,455 |
| TREI | 2.55 | 2.55 | 2.34 | 2.52 | 11,500 |
| TRG | 3.44 | 3.62 | 3.45 | 3.58 | 839,376 |
| TRIBL | 0.82 | 1.13 | 1 | 1 | 10,309 |
| TRIPF | 204 | 204.9 | 201 | 201.14 | 4,110 |
| TRSM | 3.14 | 3.15 | 2.5 | 2.62 | 560 |
| TSMF | 0.9 | 1.3 | 1.3 | 0.9 | 1 |
| TSML | 76.4 | 76.5 | 76.4 | 76.42 | 600 |
| TSPL | 1 | 0.9 | 0.88 | 1 | 268 |
| UBL | 87.16 | 89.9 | 87.3 | 88.89 | 2,285,219 |
| UBL-CAUG | 88.97 | 0 | 0 | 90.69 | 0 |
| UBL-CJUL | 87.62 | 0 | 0 | 89.32 | 0 |
| UBL-CSEP | 90.05 | 0 | 0 | 91.79 | 0 |
| UBL-JUL | 87.36 | 89.89 | 88 | 89.17 | 75,000 |
| UBLTFC2 | 95.05 | 0 | 0 | 95.05 | 0 |
| UBLTFC4 | 100.9056 | 0 | 0 | 100.9056 | 0 |
| UDPL | 8.81 | 8.12 | 8 | 8.09 | 500 |
| ULEVER | 7121.48 | 7275 | 7155 | 7156 | 180 |
| UNIC | 10.5 | 10.2 | 9.5 | 9.5 | 2,495 |
| UPFL | 2867.22 | 2825 | 2750 | 2752.5 | 42 |
| UVIC | 3 | 2.4 | 2.4 | 2.4 | 4,602 |
| WAHN | 47.08 | 46.5 | 46.5 | 47.08 | 250 |
| WTCL | 2.02 | 2.14 | 2 | 2.13 | 187,340 |
| WTL | 2.11 | 2.21 | 2.07 | 2.12 | 490,210 |
| WYETH | 859 | 874.99 | 860 | 860.57 | 300 |
| YOUW | 1.1 | 1.29 | 1.29 | 1.1 | 1 |
| ZIL | 103 | 102 | 102 | 103 | 1 |
| ZTL | 4.25 | 4 | 4 | 4 | 500 |
| Total Turnover | 116,202,962 | ||||
Tuesday, July 31, 2012
KSE EOD Daily Share Price Data - 17/07/2012
Monday, July 23, 2012
Mutual Funds rise by 51%YoY in FY12, reach Rs379bn
Written as on July 23, 2012
Highlights
• Mutual Funds Industry reaches Rs379bn, up by 51%YoY in FY12
• Income funds’ size appreciated massive 124%YoY during FY12
• Money Market funds showing consistency in growth
• Equity Funds remained lackluster during FY12
• Outlook - short term placements' portfolio - A safe haven
In today's value seeker we present an update on the Mutual Funds Industry performance during FY12 as well as Jun-12 along with the outlook of the sector.
Mutual Funds Industry reaches Rs379bn, up by 51%YoY in FY12
During FY12, the local mutual funds industry remained in upward trajectory as the Asset Under Management (AUM) posted a significant appreciation of 51%YoY this year, the growth momentum this year stood almost twice compared to the growth of 25% witnessed last year. Major growth was witnessed in the size of income, money market, Islamic income and Islamic money market funds, which surged by 124%YoY, 95%YoY, 43%YoY and 22%YoY respectively. An aerial view reveals that, major growth was witnessed in the AUM of the ABL Asset Management and NAFA Funds, which grew by solid 233%YoY and 102%YoY respectively during FY12. The main reason of such growth was induction of new funds under the umbrella of the company as well as appreciation in the size of income and money market funds of the respective fund managers. On QoQ basis, the performance during the 1QFY12 stood relatively depress posting the decline of 1.2% during Jul-Sept 2012, however later three quarters of FY12 witnessed robust growth of average 15%QoQ of FY12 in the size of Mutual Fund Industry. However on monthly basis, the industry posted the decline of 3%MoM to reach at Rs379bn, as compared with the figure of Rs390bn, a month ago. Out of Rs11bn redemption witnessed during the month, 70% contributed by three funds, namely ABL-Cash Fund (reduction: Rs5.3bn), UBL Liquidity Plus Fund (reduction: Rs1.4bn) and Meezan Cash Fund (reduction: Rs1.1bn).
Income funds’ size appreciated massive 124%YoY during FY12
During FY12, the fixed income funds category of open-ended funds registered an appreciation of a massive 124%YoY to reach at Rs87bn and contributed 24% of the total open-ended size of the industry as compared to 17% contribution witnessed in FY11. However, on monthly basis, the fixed income funds category declined by 1%MoM. On semiannually basis, growth in income fund during 1HFY12 stood at 41% while during 2HFY12 the category appreciated by 59%. On return basis during FY12, the income funds earned an average annualized return of 9.8%YoY, whereas the return of Jun-12 (annualized) stood at 11.3%, declining by 3bps MoM. On quarterly basis, the income funds' return remained volatile and averaged at 8.7%QoQ during 4QFY12, down by 18bps during the period.
Money Market funds showing consistency in growth
After witnessing tremendous growth of more than 100% during the last two years, the money market funds maintained high pace upward trajectory with 95%YoY growth in fund size during FY12. With the induction of two (2) new money market funds in the category, the net assets of the category reached to Rs150bn in Jun-12, as compared to the Jun-11 size of Rs77bn, becoming the largest category in the mutual funds industry. The reason behind this phenomenal growth in money market funds was the investor’s general preference for low risk better return product as provided by money market funds. However, due to redemption effect of year end, the category size decline by 7%MoM during Jun-12. During FY12, the money market funds category earned average return of 11.2%YoY with Jun-12 annualized return of 10.1%MoM, lower than 50bps over the months. As SBP kept the discount rate at existing level since October 2011, the money market funds manager are shifting their investment in 6M papers and getting better returns from their investments of treasury bills.
Equity Funds remained lackluster during FY12
The equity funds category remained stagnant standing at the same level of Jun-11 of Rs252bn. However on monthly basis, the equity funds category size appreciated by 4%MoM. On semi annually basis, equity fund has declined by 15% during 1HFY12 while appreciated by 18% during 2HFY12. The benchmark KSE100 index gained 10.4%YoY during FY12 from 12,496 levels in Jun-11, closing at 13,801 in Jun-12. The equity funds category posted an average return of 13.5%YoY, outperforming the KSE100 index by 320bps over the year. The main reason for the outperformance was superior return of AKDOPF (earned 32.3%), outperformed by ~19% from equity fund category average return, and ~22% from the KSE100 index return.
Outlook - short term placements' portfolio - A safe haven
During the last three years, the mutual funds industry mostly depended on their fixed income funds (Money market & Islamic income funds), however, with the recent upsurge in the equity market, the equity related funds' portfolio increased their assets. The current interest rates scenario advocates that the investors preferred to invest in fixed income investment venues. We expect that the SBP would keep the discount rate unchanged at 12% in the upcoming monetary policy for the next two months. In this manner, we believe that a short term placements' portfolio would be better choice of investment in current investment scenario.
HBL: 1H2012 EPS expected at Rs9.63, up 26%YoY
July 23, 2012 (JS Research)
We preview Habib Bank Limited (HBL) 2Q2012 result where the bank is expected to report unconsolidated earnings of Rs5.6bn (EPS Rs4.63), an increase of 22%YoY. However, on a QoQ basis the earnings are likely to see a marginal decline of 1%, mainly on account of lower net interest income. Cumulative 1H2012 earnings are anticipated to jump by 26%YoY to Rs11.7bn (EPS Rs9.63). This significant growth will be predominantly led by 1) expected growth of 9% in earning assets in 1H2012 and, 2) lower provisions. We do not expect any payout with the result. At current levels, we maintain our ‘Hold’ call on the scrip with a target price of Rs122.
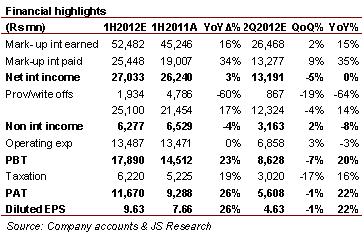
NII to remain flat in 2Q on a YoY basis
Net Interest Income (NII) of the bank is likely to remain flat at Rs13.2bn in 2Q2012 on a YoY basis. The same is anticipated to be down by 5% on QoQ basis, mainly on account of revision in the savings deposit rate to 6%. Nevertheless, 1H2012 NII is likely to grow by 3% mainly led by expected growth of 9% in earnings assets during the period.
Non funded income is likely to post a growth of 2%QoQ in 2Q to Rs3.2bn. Rising Fee & Brokerage and income from dealing in foreign currency are anticipated to be key reasons for this growth. In 1H2012, non interest income is likely to be down by 4%YoY due to lower income from dealing in foreign currency (down 40%YoY).
Loan losses to decline by 68%YoY in 2Q
Provisioning on bad loans is likely to settle at Rs732mn in 2Q, down 68%YoY and 43%QoQ. While provision on loans is likely to be on the downside in 2Q, reversal in provision for diminution in investment in 1Q is likely to aid 1H2012 result. Cumulative provisioning expense in 1H2012 is likely to register a decline of 60%YoY to Rs1.93bn.
Operating expenses on the other hand, are anticipated to remain flat at Rs13.5bn in 1H2012, further helping the bottom line.
Investment perspective: ‘Hold’
We currently maintain our ‘Hold’ call on the stock with a target price of Rs122. The scrip currently trades at 2012E PBV and PE of 1.2x and 6.2x, respectively.
+92 (21) 111-574-111 (ext: 3099)

Also in focus
Oil import bill at US$15.2bn in FY12, up 26%YoY
On the back of lower international oil prices, oil imports recorded a decline of 3%MoM in June-2012 to reach US$1.3bn. Subsequently, oil import bill clocked in at US$15.2bn in FY12 vs. US$12.1bn in FY11 (up 26%).
UBL: Analyst Briefing Takeaways
|
|

Subscribe to:
Posts (Atom)